The technology in detail
How the Listener recognizes who is speaking and where the voice comes from: the neural network layer by layer and the direction calculation with four microphones. This describes the state of the prototype.
For the overview without the technology, see the page Features.
The signal path
1Four microphones
Four digital microphones deliver sound values. They share the same clock and are sampled at exactly the same instant. This is the basis for measuring arrival-time differences.
2Preprocessing
Filters remove offsets and learn the background noise. A speech detector decides whether someone is speaking right now. Only sections containing speech continue.
3Direction
From the arrival-time differences between microphone pairs, the angle the voice comes from is calculated. It appears in the seating plan. The principle is explained further down in the section “Direction with four microphones”.
4Spectrogram
An excerpt of about 2 seconds is converted into an image. It shows which frequencies are how strong at which time.
5Neural network
The network turns the image into a fingerprint of the voice: a short series of numbers. The same voice gives similar numbers, different voices give different ones. On the chip this takes only a fraction of a second.
6Assignment
The fingerprint is compared with all enrolled voice profiles. If none matches well enough, the utterance counts as “Unknown”. The duration is credited to the recognized person.
Everything runs in the device on an ESP32-P4, without a cloud. The network is executed with ESP-DL, Espressif's deep-learning library.
The neural network
The network does not listen to words. It receives a picture of the sound, a spectrogram, and uses it to describe the voice: which frequency ranges are how strong, and how does that change over two seconds? The same person gives similar numbers, different people give different ones.
Input: the spectrogram
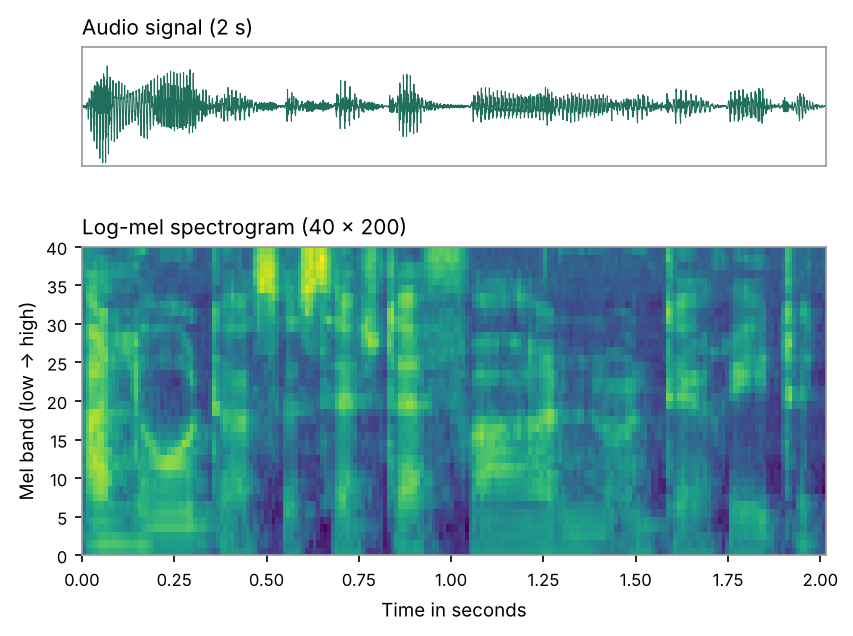
How the image is made
- The high frequencies of the signal are lifted slightly.
- The sound is cut into very short, overlapping windows.
- For each window, the strength of the individual frequency ranges is measured, in steps that follow human hearing (mel scale).
- The strength is shown logarithmically, as the ear perceives loudness. Then the average per frequency range is subtracted. This makes the fingerprint independent of microphone and distance.
The layers
The network deliberately consists only of standard building blocks that ESP-DL can run on the chip: convolution, normalization, activation (ReLU) and pooling. There is no LSTM and no attention. The bar width hints that the number of features grows from block to block.
The network is small enough to run on the device's chip in a few tenths of a second per excerpt.
How it learns
Training used public German-language speech recordings from more than a thousand speakers, part of which was only used for testing. The learning objective is ArcFace: the network is penalized if fingerprints of the same person are not close together, or if different people are not separated by a safety margin. This training part is discarded afterwards. Only the small network is in the device.
It is then converted to 8-bit numbers so it runs fast on the chip. The loss of accuracy was barely measurable in testing.
How a fingerprint becomes a name
During enrollment, each person speaks a few sentences, which become their voice profile. In operation, the fingerprint of the current utterance is compared with all profiles (cosine similarity). The best match only counts if it is above an adjustable threshold. Otherwise “Unknown” is counted. Short and long utterances are prepared accordingly.
Measured values
| Measurement | Result |
|---|---|
| Error rate (EER) on speakers the network has never seen | 4.9% (without a network about 24%) |
| Hit rate in a round of 5 people (on a PC) | about 99% |
| Computation time on the ESP32-P4 | about 0.13 seconds per 2-second excerpt |
Context: The test data consists of clean read-aloud recordings. With table microphones, room reverberation, distance and people talking over each other, recognition will be worse. How much worse, we are currently testing with our own recordings.
Direction with four microphones
Sound takes about 2.9 ms per metre. When a voice hits the device at an angle, it reaches the four microphones at minimally different times. From these arrival-time differences, the angle can be calculated.
The microphones are only a few centimetres apart. The differences are therefore tiny, smaller than a single sample. So the delay has to be determined to a fraction of a sample.
Top view. M1 and M2 are at the front, M4 and M3 at the back.
Step by step
1Form pairs
Four microphones give 6 pairs (4 sides, 2 diagonals), in general N(N−1)/2.
2Delay per pair (GCC-PHAT)
From two microphone signals the cross-spectrum is formed and divided by its magnitude, so only the phase remains (phase transform). The inverse transform gives a curve with a sharp peak at the delay. This makes the method robust against reverberation and differing loudness.
Only the frequency range where speech lives is evaluated, and the peak is interpolated between samples. The measurement only counts in windows where speech is detected.
3Find the angle
For a distant sound source a plane wave applies. The delay of a pair then depends only on the angle θ:
pi and pj are the microphone positions. A single pair gives two possible angles (θ₁ and θ₂, mirrored front and back). So the angle is sought at which the predicted delays of all six pairs fit the measured ones best. This also averages out measurement noise. If the voice is higher than the microphones, that is taken into account too.
4Result over 360°
Because the microphones lie in a plane, the angle is unambiguous around the full circle. With only two microphones (earlier version) the device therefore shows only the front half circle.
Calibrate once: With a voice from the front, the device determines which microphone row is at the front, so the display is not mirrored.
Measured values and limits
| Measurement | Result |
|---|---|
| Circle test with speech, device at 1 m distance | 0° → 0°, 90° → 90°, 180° → 170°, 270° → 264 to 266° |
Limits: Pure tones are unsuitable because the phase cannot be assigned unambiguously. Speech or noise works. A loud fixed noise source close to one microphone (for example a fan) distorts the measurement. When two people speak at the same time, the device usually shows the louder one. The angles are measurements from the prototype and not yet a guaranteed accuracy.
Noise and music
Noise filter: The device learns the spectrum of the background and keeps it up to date. If the level rises permanently, for example when music starts, the profile adapts. Voice activity is evaluated only in the frequency range where speech lives, so that loud bass does not mask the voice. In simulation, speech over music was detected and the music part was not.
Beat detection: The device checks whether a steady tempo is present, as in music. At the moment the beat is only displayed and not yet used to hide music.
Questions or ideas about the technology?
The Listener is a prototype. The survey shows us which features matter.
Take the survey (German)